A new data release measures where hitters stand and where they make contact
One of the best parts of our era of baseball history is the slow and steady march toward a more complete understanding of the game. Statcast and the periodic public release of new data and metrics from its measurements continually drive us forward.
Early last season, we got our first taste of bat tracking, which included swing speed and length, fast swing rate, squared-up rate, and blasts.
Those data allowed us to have objective measurements that told us that Matt Wallner can swing a bat incredibly fast, that Byron Buxton’s wiry frame produces the longest swing on the club, and that yes, contrary to the eye test in Twins Territory, the Twins do shorten up in two-strike counts.
That release was followed by extensive analysis by the hive of public analysts, which generally found that fast and longer swings produce more power and whiffs, while slower swings lead to more contact but less power. Swing speed is also highly reliable and “stabilizes” very quickly.
And, like most everything else in baseball, there is no one-size-fits-all approach. A faster swing is not universally better than a slower swing. It’s just different, and it comes with pros and cons. To that point, some hitters last season found more success when they slowed down their swings and the most productive swings tend not to be of the swing out of your shoes variety.
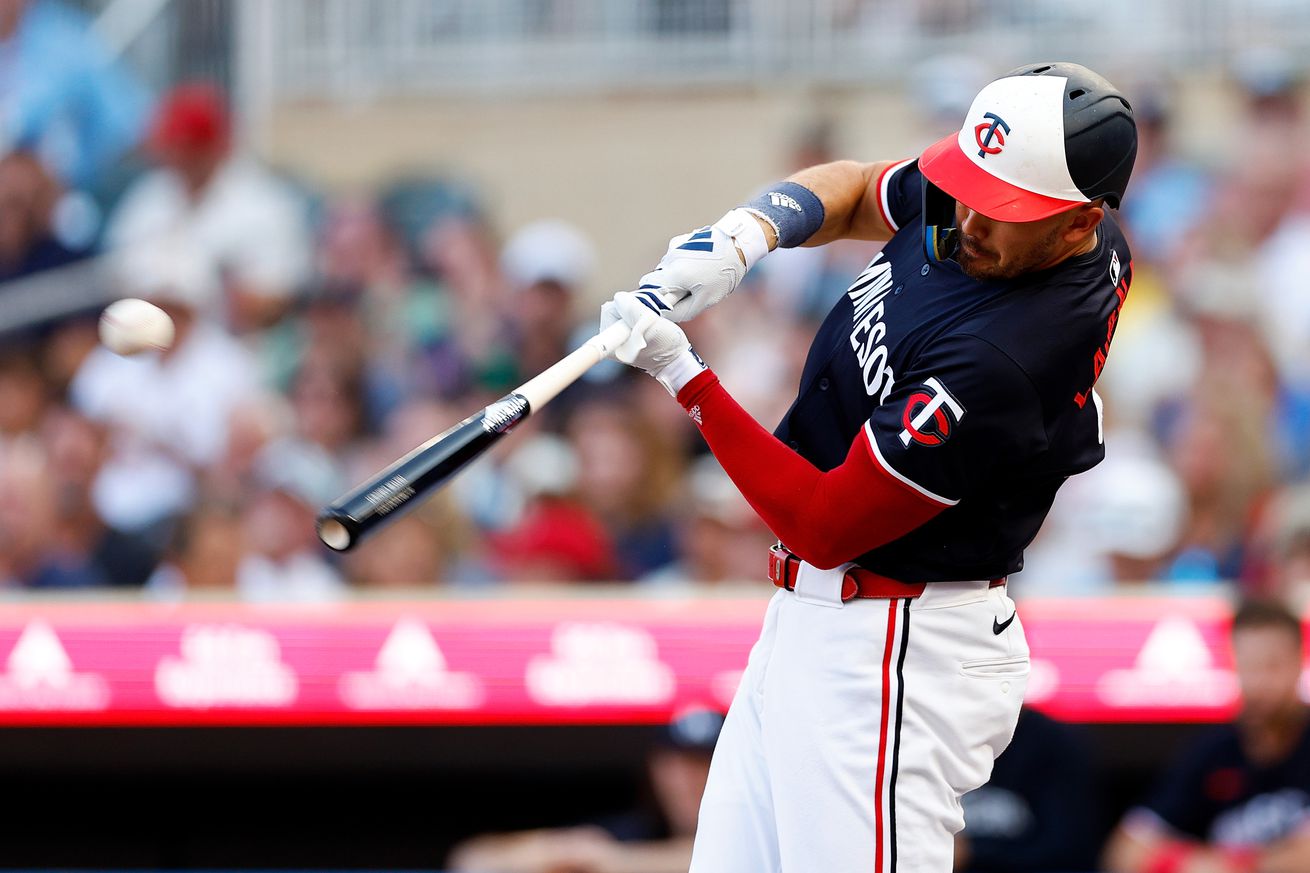
Still, there was a lot we couldn’t get from that data. Last week, Statcast released their next round of bat-tracking data, closing a couple more gaps. Now, we know where hitters stand in the batter’s box relative to home plate and where they make contact with the ball relative to the plate and their body. The illustration below, which I borrowed from the link above, explains the new measurements:
Credit Mike Petriello, accessed from LINK
Analysts covering the game are investigating these new metrics. At the aggregate level, some initial findings have confirmed what we already knew. For instance, home runs are most often hit out in front. The average intercept point for contact across the league is 30 inches in front of a player’s center of mass, but the average point for a home run is 36 to 38 inches out front, and 82% of home runs were hit between 25 and 45 inches out front.
The “launch angle revolution” is often misunderstood as hitters taking uppercut swings. It’s not about that, but rather about making contact out front. That’s where the bat moves the fastest and at an upward angle, which creates pulled balls in the air, which tend to be the most productive balls in play. This data helps confirm that yet again.
I’ll invite you to check it out on Savant’s batting stance leaderboard. There you’ll find that Willi Castro is the Twin who stood deepest in the box last season, while Royce Lewis was the furthest forward. Ryan Jeffers and Brooks Lee had the widest batting stances, with about 37 inches between their feet.
Unsurprisingly, Matt Wallner and his pulled fly balls had the farthest forward average intercept point at 36 inches in front of his center of mass. On the opposite side was Edouard Julien at 28.4 inches.
Here are some observations from this data that I found interesting.
Royce Lewis
On Opening Day last season, Lewis popped a homer off Cole Ragans in his first at bat. He pulled a quad muscle later in that game that put him on the shelf for more than 2 months. Returning in June, he looked as good as ever, producing a 167 wRC+ with 9 homers across 95 plate appearances that month. Yet another injury derailed July before Lewis showed clear signs of wearing down in August and September (95 and 44 wRC+, respectively).
When I wrote about Lewis’s late season slump in the last week of the season last year, I noted that his swing speed had declined month over month as the season dragged on and that his swing-take decision-making tanked in September.
This new data shows that story. (In addition to capturing Lewis’s unique timing move at pitch release—he’s one of just a few players whose feet get further apart when initially stepping into the pitch.)
GIF taken from Baseball Savant
As Lewis’s swing speed declined, his average intercept point was deeper into the plate and his center of mass by about 3 inches.
He got that back out front in September — the solid purple dot in front of the plate above was his furthest out front intercept point of the season. But that adjustment coincided with his chase rate ballooning to 37.1%, the highest monthly mark of his career. Taken together, those might indicate a hitter who was guessing and trying to cheat on pitches. Guess right and get to it early. Guess wrong and leave yourself vulnerable to chasing pitches out of the zone.
Trevor Larnach
Larnach had the most productive season of his career last year, chopping his strikeout rate by almost 12 points and posting career bests in nearly every other offensive category. Much of that raised performance was attributed to mechanical and approach changes that I detailed in depth late last season.
Larnach closed his stance, eliminating a lot of pre-pitch movement from his swing. He also changed his approach, not trying as hard to catch the ball out front. This enabled him to put up a better fight against the breaking and off-speed pitches that had previously tied him in knots.
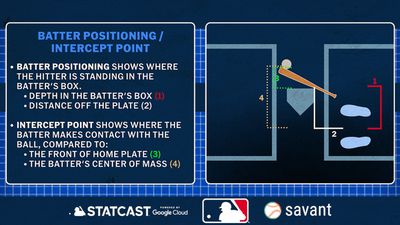
As I noted at the time, the irony in that was that he was able to pull the ball, often in the air, more often than ever before. With this stance and contact point data, we can see those changes very clearly:
Visuals from Baseball Savant
Larnach’s stance went from 23 degrees open in 2023 to 0 degrees last season, and he widened his feet about 6 inches. As a result, he didn’t need to move much to get into position to hit, which helped his average intercept point with the ball push up a couple of inches, leading to more pulled batted balls
Matt Wallner
If you need more convincing that there isn’t one “right” way to do this, I give you the Minnesota Moose, Matt Wallner, who made adjustments in the opposite direction from Larnach.
You’ll recall that Wallner’s 2024 season got off to a disastrous start. After making the club out of Spring Training, he started the year with 2 hits, 3 walks, and a whopping 17 strikeouts in 33 plate appearances and looked completely lost.
Wallner was especially having trouble with inside pitches (.237 wOBA) and felt he couldn’t get the barrel out front to pull the fly balls that drive his production.
A trip to St. Paul for May and June allowed Wallner to reset and make some adjustments, which we can easily see in this new data. Here’s a side-by-side of Wallner’s stance at the beginning of last season and when he returned to the majors in July:
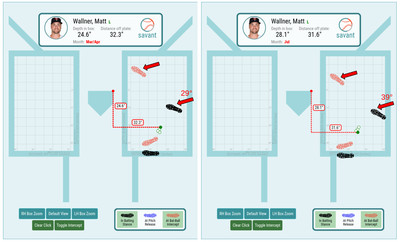
Visuals from Baseball Savant
Early in the season, Wallner’s stance was less open at 29°, and his move into the pitch closed his front side, hampering his ability to get the barrel to pitches inside.
When he returned in July, his initial stance was more open at 39°, and his front foot landed more in line with his back foot and the pitcher than it had before. Wallner also set up about 4 inches deeper in the batter’s box. After these adjustments, he batted .282/.386/.559 with 12 homers overall, including a .372 wOBA against inside pitches.
Carlos Correa and Two Strikes
Hitting with two strikes in the count is exceptionally difficult. Since the beginning of the 2021 season, the league has collectively hit .170/.245/.267 with two strikes. That works out to a .232 wOBA and is 175 points lower than the .407 wOBA hitters produce in counts with fewer than two strikes.
Among the current Twins, the most productive hitter with two strikes has been Carlos Correa. He’s hit a combined .192/.281/.302 with two strikes over the past three seasons, which has been good for a .264 wOBA. That mark might not look good in a vacuum, but it is 30 points above the league average and ranks near the 90th percentile for all hitters in those counts.
The batting stance and intercept point data reveal the small tweaks that Correa employs to hold his own in two-strike counts:

Visuals from Baseball Savant
With two strikes (left-hand side above), Correa sets up slightly deeper in the box, slightly closer to the plate, and with a slightly wider stance than he does otherwise.
And he lets the ball get about four inches deeper into the plate, which you can see with the solid purple dots in the comparison above. In other counts, he’s made contact about 29 inches in front of his center of mass on average. With two strikes, that has changed to about 25 inches, indicating a clear shift to a defensive approach to protect the plate.
John writes for Twinkie Town, Twins Daily, and Pitcher List, with an emphasis on analysis. He is a lifelong Twins fan and former college pitcher.